製品
製品一覧
パパラボの2次元色彩計は、色と質感を同時に測定できる高精度な測定機器です。取得した画像データをもとに、従来の単点測定では見落とされがちな色ムラや微細なテクスチャの違いを、面全体の比較によって正確に把握できます。この技術により、測定工数を削減し、品質管理の効率化を実現。さらに、データの記録・蓄積を通じて、長期的な品質の追跡やトレーサビリティの強化にも対応し、信頼性の高い製品づくりを支援します。
製品の基本情報については、以降のページで詳しくご紹介します。
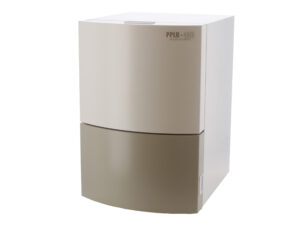
卓上型2次元色彩計
PPLB-440
人の目に代わって色と質感を「見える化」するカメラ方式の色彩計です。測定エリアは1mm~A4サイズ程度まで。暗室空間で安定的に色を測定できます。
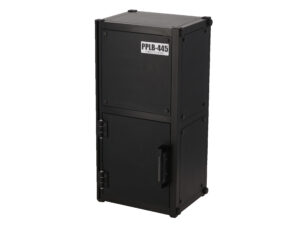
コンパクト卓上型2次元色彩計
PPLB-445
卓上型2次元色彩計の性能はそのままに、約10kgの軽量・コンパクトな新モデルをご用意しました。B6サイズ程度までの小型サンプルの測定にお勧めです。
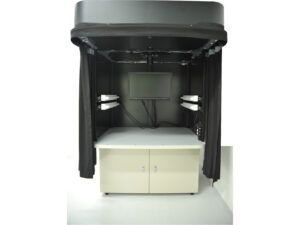
色・絵柄検査装置
PPLB-240
A3サイズ以上の印刷物や建材など、従来の装置では対応が難しかった大判サンプルを一度に測定・比較できる、広範囲対応のカメラ方式2次元色彩計です。
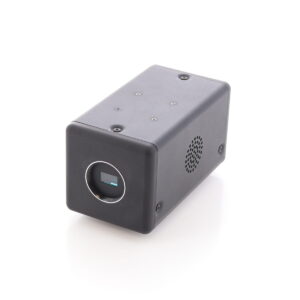
高解像度色彩センサ
RC-4000
高精度な色と質感を定量化するカメラ方式の色彩センサ。面での色解析や履歴管理にも対応し、品質管理やDXを強力に支援。検査装置への組み込みも可能です。
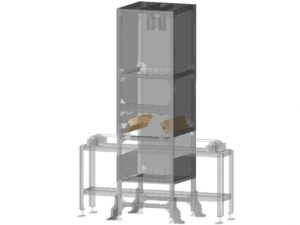
インライン検査装置
特注自動検査装置
高速・高精度のデジタル検査で、製品の色と質感を非接触かつ一括測定。リアルタイム判定により人手に依存しない安定した品質管理を実現します。